Key Takeaways:
- Start with the business-critical services and the user experience it is expected to deliver, then work backward through the supporting path.
- Treat availability, response time, path health, utilization, and traffic behavior as complementary signals rather than a single diagnosis.
- Establish a normal baseline before a migration or major change so alerts point to meaningful deviations.
- Keep the checklist current as cloud-connected services, remote sites, and dependencies change.
Hybrid IT monitoring is the practice of tracking the availability, performance, dependencies, and network paths that support services running across cloud-connected and on-premises environments. It is not just a separate list of cloud workloads and local devices. The goal is to understand the route a user-facing service takes and the systems that can affect it.
That distinction matters because a cloud service can be healthy while users still have a poor experience. A congested link, a gateway, a VPN, a firewall, a local infrastructure dependency, or a change at a branch site can interrupt the path before traffic reaches the cloud workload. Hybrid monitoring gives IT a way to investigate the broader operational picture.
Why the Cloud Being Up Does Not Always Mean the Service is Working
Cloud adoption changes the monitoring problem—it does not remove it. A user may reach a cloud-hosted application through a local network, a branch connection, an internet edge, a gateway, a VPN, a firewall, a load balancer, or a dependency that remains on premises. The application may be available while one of those components degrades.
This is different from deciding whether the monitoring platform itself should run in the cloud or on premises. For that deployment-model decision, see On-Premises vs. Cloud Network Monitoring. This checklist is about keeping a service path visible when workloads and dependencies span multiple environments.
The 7 Check Hybrid IT Monitoring Checklist
When a cloud application is slow or unavailable, the cause may sit in the workload, the network path to it, a local dependency, or the connection between environments. Use this checklist to build practical visibility across the service path.
1. Define the Critical Service and its User-Facing Endpoint
Begin with the service that matters to users or operations, not a generic list of devices. Clarify what working looks like: a reachable page or application endpoint, an acceptable response time, a healthy service state, or a connection that stays available during business hours. This gives the monitoring plan a practical outcome to protect.
2. Identify the Network Path to the Cloud-Connected Service
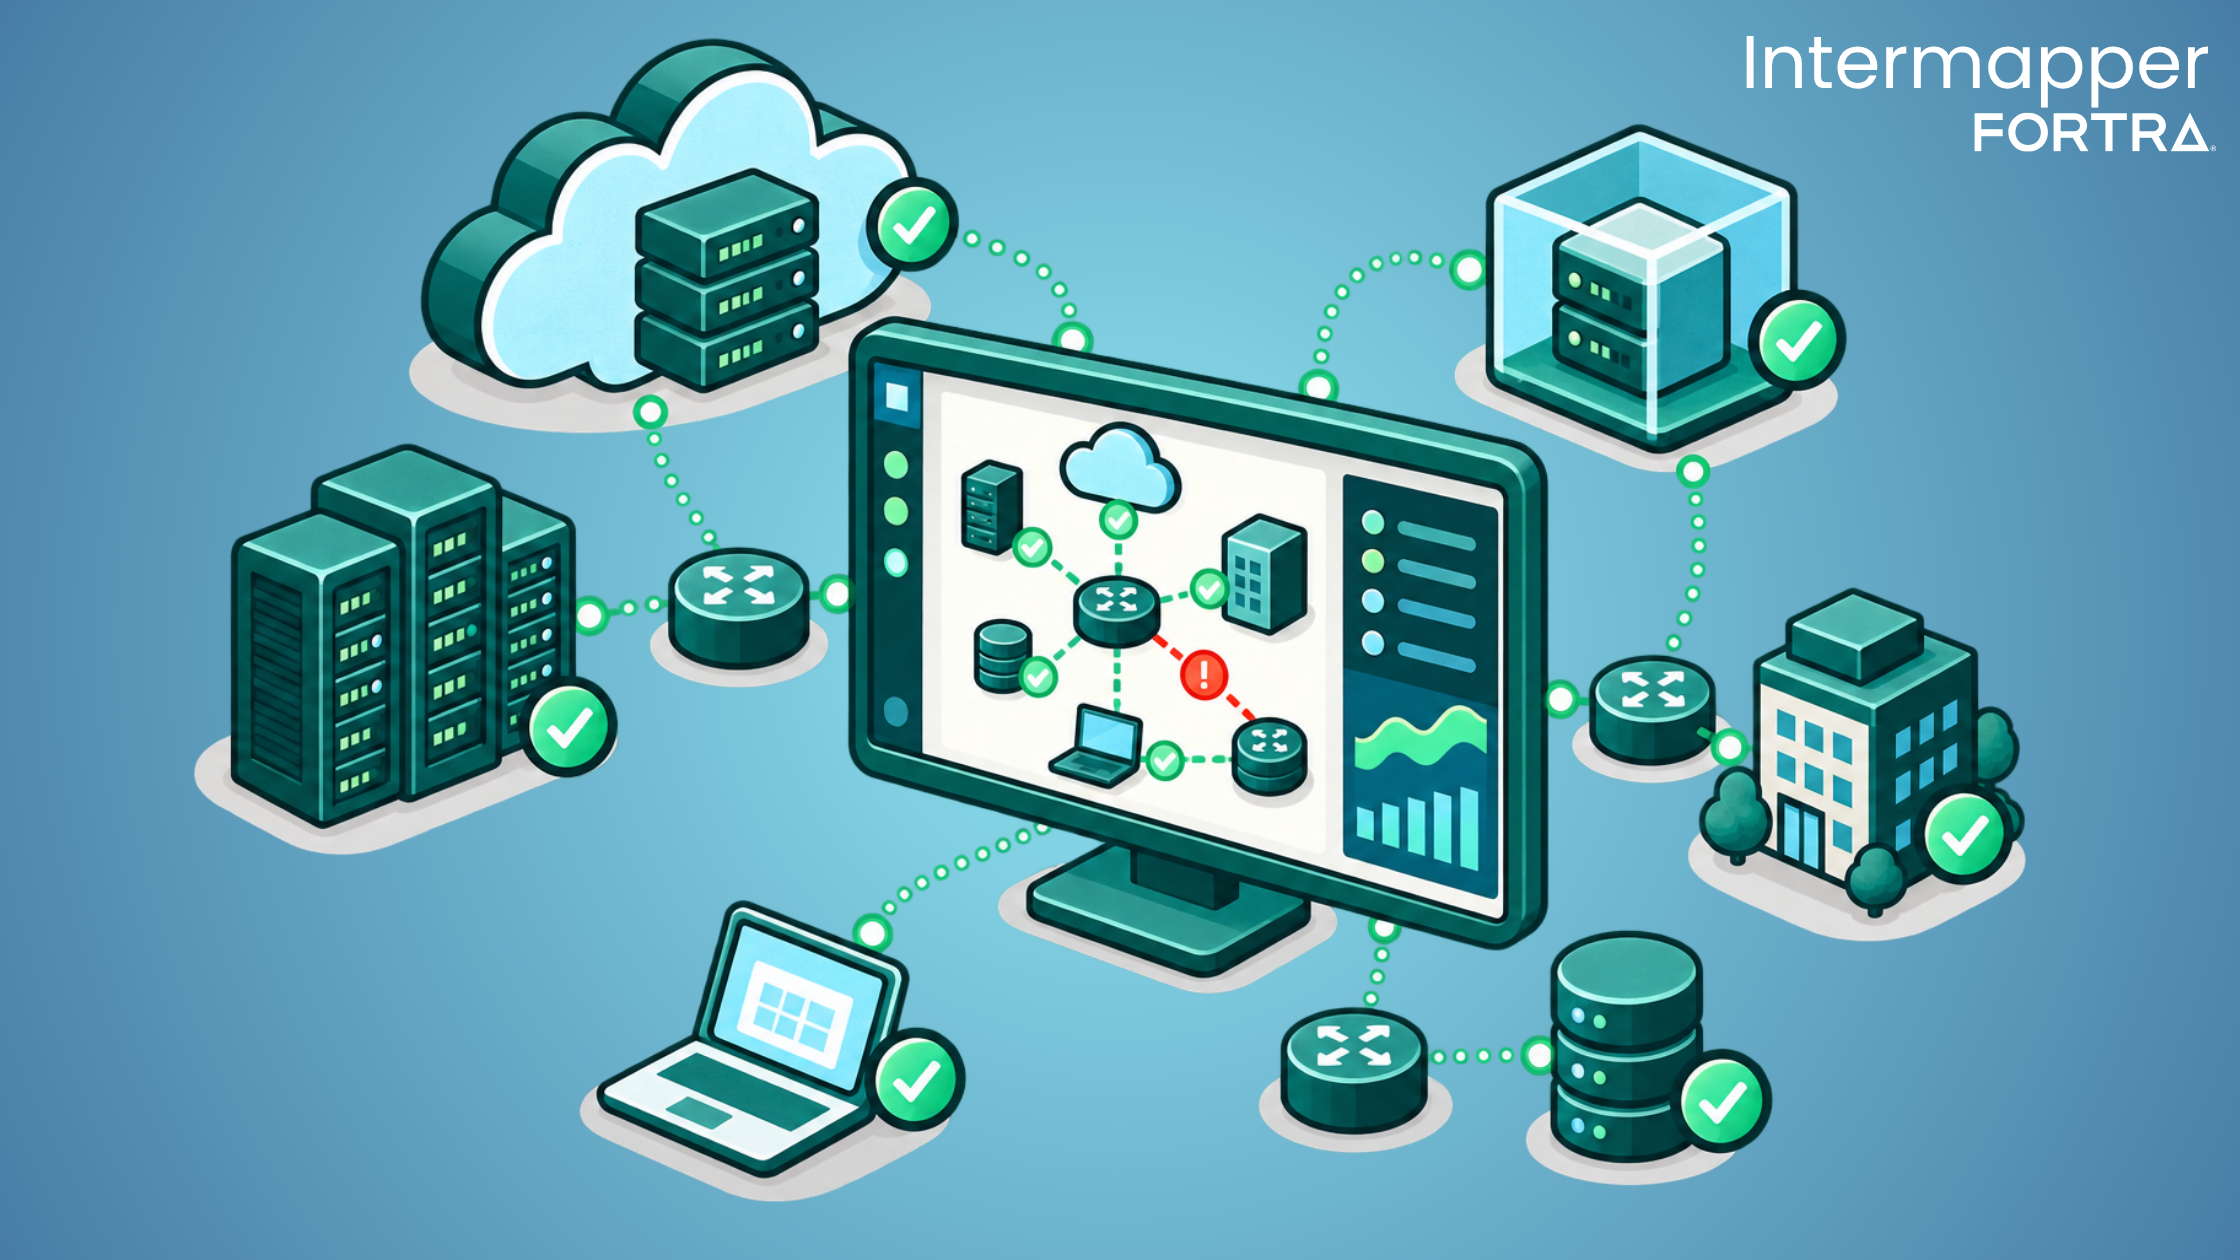
Document the parts of the path that may affect access, including relevant routers, firewalls, gateways, links, VPNs, internet edges, and branch locations. Live network maps are valuable here because they show status and relationships in context, which is particularly useful when an issue affects only one connection or site.
3. Include Supporting On-Premises Dependencies
Do not stop at the cloud edge. A cloud-connected service may depend on local identity services, physical or virtual servers, network services, application endpoints, or infrastructure that remains on premises. Identify the dependencies that can prevent users from reaching or using the service, then decide which of those components should be included in routine monitoring.
4. Confirm What is Reachable and What Metrics Each System Exposes
Cloud environments are not one uniform monitoring surface. Coverage depends on the endpoint, network reachability, access, credentials, supported protocols, and vendor-exposed metrics. Define the exact signals that are practical and useful for each cloud-connected system or service. This avoids a false sense of coverage and makes it clear where provider-native tools should complement network and infrastructure monitoring.
5. Watch for Path Quality and Capacity Signals
Availability alone is not enough. Track the indicators that can reveal a degrading user experience, such as response time, service status, packet loss, interface health, utilization, and other relevant performance measures. Use a baseline to distinguish ordinary fluctuations from conditions that need investigation, especially before and after migration, routing, or capacity changes.
6. Investigate Traffic When Utilization Alone is Not Enough
A busy link tells you that demand is high, but not necessarily why. When an important path begins to saturate, traffic context can help teams understand who is communicating, where traffic is going, and what type of activity may be contributing to the change. Use that evidence to troubleshoot bandwidth issues rather than assuming every spike is a cloud performance problem.
7. Set Ownership Thresholds and an Escalation Path
Monitoring becomes useful when the right team sees the right condition with enough context to act. Assign ownership for the service path, set thresholds that reflect user or business impact, and tune notification timing to reduce noise. Review recurring alerts and historical patterns so thresholds stay aligned with real operating conditions as the environment changes.
How Intermapper Supports Hybrid Infrastructure Monitoring
Intermapper supports the parts of this checklist involving reachable, IP-enabled infrastructure and supported performance data. Bring cloud-connected workloads, virtual systems, and on-premises devices into one live operational view. Intermapper uses live maps, probes, alerts, status views, historical trends, and traffic analysis to monitor cloud-connected and on-premises components in operational context.
- Intermapper Network & Server Monitoring discovers devices across sites and distributed network environments, making it easier to maintain a current picture of hybrid infrastructure.
- Built-in and custom probes let you monitor the health signals that matter most, including availability, response time, application service status, and supported device-specific metrics.
- Configurable thresholds, notifications, and escalation rules help teams respond when an issue in a local or cloud-connected dependency could affect a business service.
- Intermapper Advanced Reporting shows historical performance, utilization, and traffic data to give teams the context to investigate bottlenecks, identify recurring patterns, and plan infrastructure changes with more confidence.
- Intermapper Flows Insight delivers bandwidth monitoring, traffic analysis, and NetFlow visibility that provide deeper insights for understanding network utilization.
- Intermapper Server Insight adds the ability to get detailed data from inside a cloud instance—such as process data—which allows the root cause of a problem to be determined quickly and accurately.
- Intermapper Foresight adds What-If capabilities, such as What-If my workload grows 20 percent next year or What-If I have to cater for extra users because of a merger? Additionally, Foresight helps predict the performance of migrating an existing application to cloud.
The operational value of Intermapper is helping IT teams see the reachable systems and connections that support a hybrid service and investigate issues with more context.
Keep Hybrid Service Paths Visible with Intermapper
See What's Happening. Understand Why. Plan What's Next.