IT leaders need more than dashboards. They need evidence that networks, servers, applications, and services are performing as expected. Intermapper helps teams turn monitoring data into useful reports that support management conversations, service reviews, capacity planning, incident follow-up, and compliance documentation.
- Report on network health, availability, performance, and trends.
- Use historical monitoring data to explain what happened and what changed.
- Provide management with clearer visibility into infrastructure status.
- Support audit and compliance conversations with documented monitoring evidence.
- Reduce manual reporting effort with reusable performance views and report outputs.
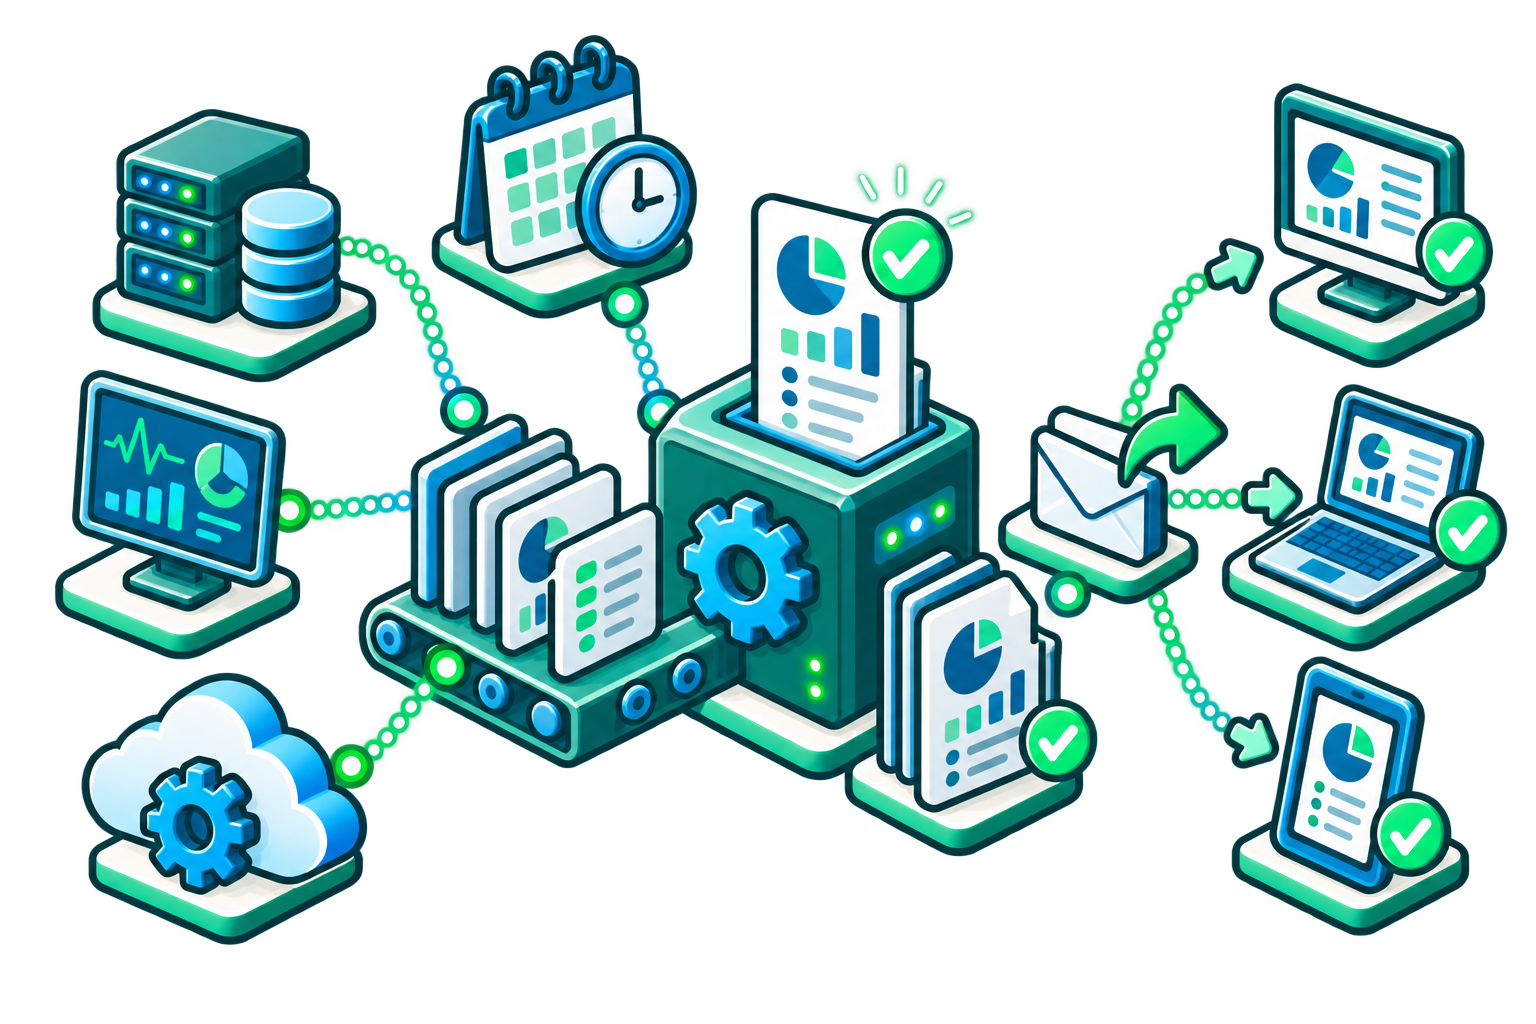
How to Report on IT Performance with Intermapper
Many organizations have monitoring data, but they still struggle to turn it into clear reports for leaders, auditors, service owners, and operations teams. When reports are created manually, they take time, introduce inconsistency, and often lack the context stakeholders need.
Intermapper helps teams move from one-off reporting to a repeatable reporting approach grounded in real monitoring data, live status, historical trends, and visual network context.
Define Report Audiences
Select Report Metrics
Create Operational Views
Generate Reports
Review Exceptions
Use Reports to Improve
Intermapper’s IT Reporting Capabilities
Management Reporting

Give IT leaders and business stakeholders a clear view of network health, uptime, trends, and current risk.
Compliance and Audit Support
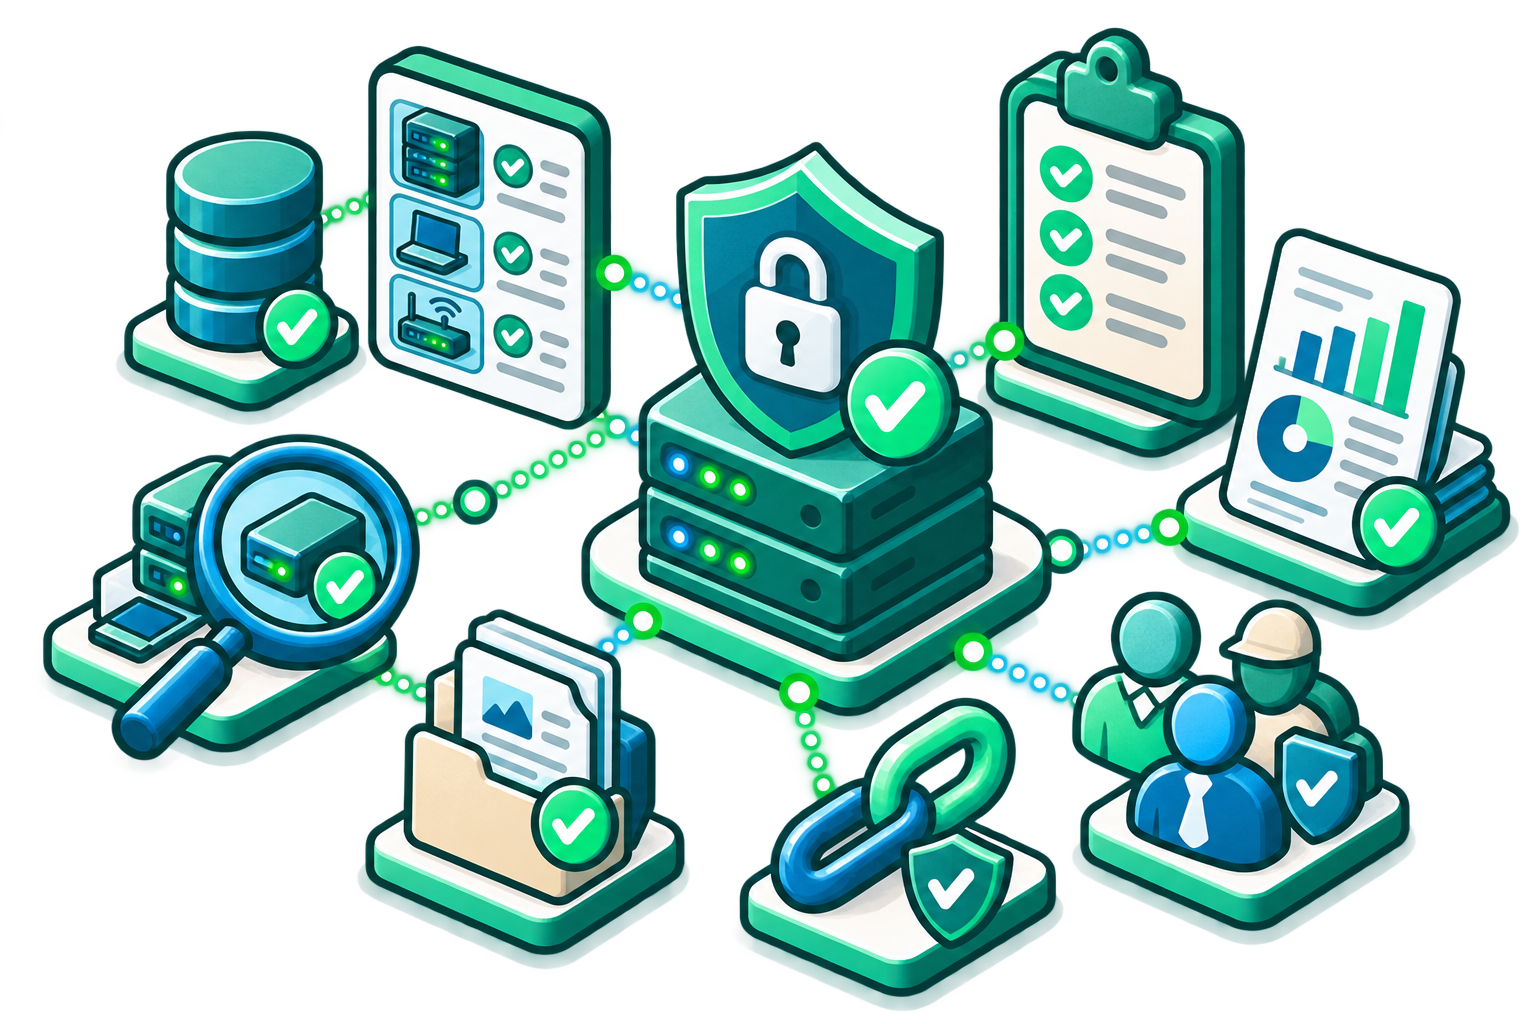
Use documented maps and historical performance data to support audit conversations and demonstrate monitoring practices.
Incident Review Reporting
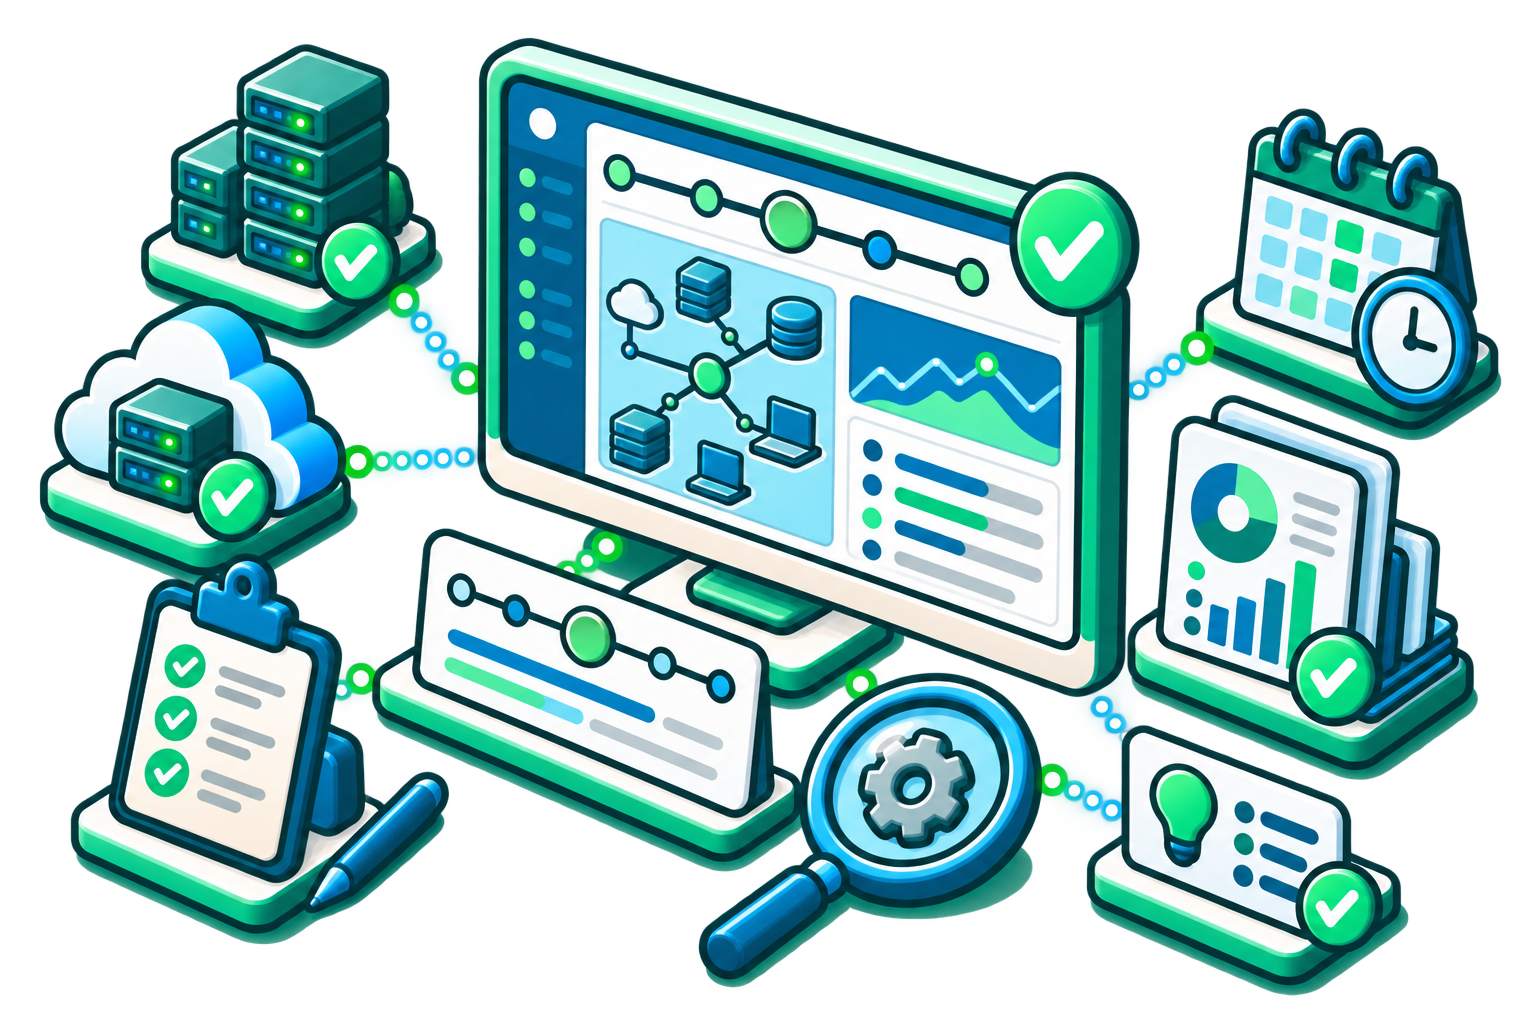
Use historical status and trend data to explain what happened, when it happened, and what systems were affected.
Capacity Planning Reports

Show utilization trends and recurring bottlenecks to support bandwidth troubleshooting, hardware, or resource investment decisions.
Operational Team Reviews

Create reports that help network, server, and service teams prioritize recurring issues and improvement work.
How Intermapper Solves IT Reporting Challenges
| Challenge | How Intermapper Helps | Result |
|---|---|---|
|
Reports are manually assembled
|
Monitoring data is captured continuously and can be reused in reports and views.
|
Teams reduce manual collection and create more consistent reporting.
|
|
Managers need a high-level view
|
Live maps and summary views show current network health and device status.
|
Leadership gets clearer visibility into operational health.
|
|
Audits require evidence
|
Maps, reports, and historical data can document infrastructure status and performance.
|
Teams can support compliance and audit conversations with monitoring evidence.
|
|
Incident reviews lack detail
|
Historical trends and status data show what changed and when.
|
Teams can explain root cause, impact, and response more clearly.
|
|
Capacity requests need justification
|
Trend graphs and utilization reports support infrastructure planning.
|
IT can make data-backed budget and upgrade requests.
|
|
Service owners need recurring updates
|
Reusable performance views and reports help communicate uptime and trends.
|
Stakeholders can review service health more consistently.
|
IT Operations Reporting FAQs
Turn Monitoring Visibility Into Operational Evidence with Intermapper
See What's Happening. Understand Why. Plan What's Next.